Interactive maps with leaflet
Have you ever had some spatial data, for example the coordinates of some weather stations or a shapefile of your study area and wanted to diplay it in context of a map or an arial photograph? For quite a while you could do this for example with the RgoogleMaps package which can download map tiles from google maps. But this is a very static approach: you can’t scroll around or zoom in and out.
Since June 2015 there is a new approach: having your maps interactive like you are used from google maps or openstreetmap.org
but with addition of your own data. The package that maks this possible is
Leaflet for R which uses the open source leaflet javascript library. With this package you can insert a one-liner into your knitr code and R does all the rest: it inserts a container <div> to contain the map into your html page and adds the needed javascript code and the corresponding libraries into the head.
Where do the maps come from?
You can use two types of map services: TMS (Tile Map Service) or WMS (Web Map Service). Providers are for example openstreetmap.org, google maps or Esri. A whole range of providers are already implemented into the R package. But you can also find for exampe some governmental agencies who provide map services. For example search for “DGM” (german abbreviation for DEM, Digital Elevation Model) at geoportal.de.
Tile Map Service (TMS)
Tile Map Service servers provide image files with a simple url template: http://{s}.tile.openstreetmap.org/{z}/{x}/{y}.png. You have to replace{z} with the zoom level and {x} and {y} with the tile coordinates. Some map tile servers additionally have different subdomains. tile.openstreetmap.org for example uses a, b and c. So replace {s} with one of those subdomains. For example we can download a map of europe with this url: http://a.tile.openstreetmap.org/3/4/2.png
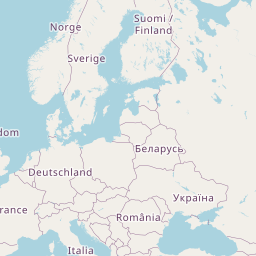
Of course this is only a still image. Leafletjs then adds a lot of interactivity and dynamic loading of new image tiles to provide you with the experience of an interactive map. In the leafletjs reference you find some more information about Tile Layers.
Web Map Service (WMS)
To request a map from a Web Map Service is a bit more complex, but you also get additional features. According to Wikipedia:
ALL WMS provide two basic features:
- GetCapabilities - returns parameters about the WMS (such as map image format and WMS version compatibility) and the available layers (map bounding box, coordinate reference systems, URI of the data and whether the layer is mostly opaque or not).
- GetMap - returns a map image. Parameters include: width and height of the map, coordinate reference system, rendering style, image format.
Additional request types that WMS providers may optionally support include:
- GetFeatureInfo - if a layer is marked as ‘queryable’ then you can request data about a coordinate of the map image.
- DescribeLayer - returns the feature types of the specified layer or layers.
- GetLegendGraphic - return an image of the map’s legend image, giving a visual guide to map elements.
The request is not done with a simple url. So we leave it to libraries like leafletjs to do the request for us.
Use leaflet maps in R
Let’s start by installing the package and loading it:
install.packages("leaflet")library(leaflet)Then just type leaflet() to create a plain leaflet map. Add an openstreetmap tile with addTiles().
leaflet() %>% addTiles()We use the magrittr forward-pipe operator here to pipe the map object we created with leaflet() as first argument to the addTiles() function. openstreetmap.org is the default urlTemplate for addTiles() so we don’t have to provide this argument either. Similarly you can access for example a global temperature map from openweathermap.org with addTiles(urlTemplate = "http://{s}.tile.openweathermap.org/map/temp/{z}/{x}/{y}.png") but for this you have even a different method: simply type addProviderTiles("OpenWeatherMap.Temp) and you get the same result.
With the addition of %>% setView(-93.65, 42.0285, zoom = 4) you can set the start view to a certain geolocation and zoom level.
With addWMSTiles() you can add maps from WMS servers as shown in examples later on.
Having one of these base layers you can start adding your own content with for example addMarkers(), addPolygons(), addRasterImage(), addGeoJSON() and so on.
Example: Weather map
Our first example shows how to show one of several basemaps (openstreetmap, CartoDB, Esri Orthophotos or OpenTopoMap) and add additional weather information like clouds, rainfall, snowfall, temperature or wind speed on top of it. This also demonstrates how to show and hide layers on your maps. The code for the weather map is shown in the footnote1.
Find more maps
Now we will try to find some additional maps. A lot of agencies nowadays provide maps via WMS.
From http://www.wms.nrw.de/gd/guek500 we can get for example a map of the geology of Western Germany.
leaflet() %>% addTiles() %>% setView(7.5, 51.5, zoom = 7) %>% addWMSTiles("http://www.wms.nrw.de/gd/guek500",
    layers = c(0), options = WMSTileOptions(format = "image/png", transparent = TRUE),
    attribution = "© <a href='https://www.geoportal.nrw.de'>geoportal.nrw.de</a>")
geoportal-th.de provides a very detailed digital elevation model of the German state Thüringen:
leaflet() %>% setView(10.5, 50.5, zoom = 13) %>% addWMSTiles("http://www.geoproxy.geoportal-th.de/geoproxy/services/DGM",
    layers = "DGM5", options = WMSTileOptions(format = "image/png", transparent = TRUE),
    attribution = "© <a href='http://geoportal-th-de'>geoportal-th.de</a>",
    )
In this pdf you find a whole range of urls and layer names to display a whole variety of maps provided by geoportal-th-de. Unfortunately these maps are all referenced incorrectly or have to be loaded with a different reference system.
At www.geoportal.nrw.de you can find WMS maps provided by the German state Nordrhein-Westfalen. For example this digital elevation model:
leaflet() %>% setView(8, 51.277444, zoom = 15) %>% addWMSTiles("http://www.wms.nrw.de/geobasis/DGM_Relief",
    layers = "DGM_Relief", options = WMSTileOptions(format = "image/png",
        transparent = TRUE), attribution = "© <a href='https://www.geoportal.nrw.de'>geoportal.nrw.de</a>")
Add your own content
This section still has to be written…
What to do next?
Have a look at all the plugins you can use with leaflet maps.
    leaflet() %>% addTiles(group = "openstreetmap") %>% addProviderTiles("CartoDB.Positron",
        group = "CartoDB Positron") %>% addProviderTiles("Esri.WorldImagery",
        group = "Esri WorldImagery") %>% addProviderTiles("OpenTopoMap", group = "OpenTopoMap") %>%


    addProviderTiles("OpenWeatherMap.Clouds", group = "clouds2", , options = tileOptions(opacity = 0.6)) %>%
        setView(10, 51, zoom = 3) %>%
    addTiles(urlTemplate = "http://{s}.tile.openweathermap.org/map/temp/{z}/{x}/{y}.png",
        attribution = "Weather data © OpenWeatherMap", group = "temp", options = tileOptions(opacity = 0.6)) %>%
        addTiles(urlTemplate = "http://{s}.tile.openweathermap.org/map/precipitation/{z}/{x}/{y}.png",
            attribution = "Weather data © OpenWeatherMap", group = "precipitation",
            options = tileOptions(opacity = 0.6)) %>% addTiles(urlTemplate = "http://{s}.tile.openweathermap.org/map/snow/{z}/{x}/{y}.png",
        attribution = "Weather data © OpenWeatherMap", group = "snow", options = tileOptions(opacity = 0.6)) %>%
        addTiles(urlTemplate = "http://{s}.tile.openweathermap.org/map/wind/{z}/{x}/{y}.png",
            attribution = "Weather data © OpenWeatherMap", group = "wind",
            options = tileOptions(opacity = 0.6)) %>% # draw lines above
    addProviderTiles("Stamen.TonerLines", group = "Stamen Toner Lines") %>%

    addLayersControl(baseGroups = c("openstreetmap", "OpenTopoMap", "CartoDB Positron",
        "Esri WorldImagery", "none"), overlayGroups = c("clouds2", "temp",
        "precipitation", "snow", "wind", "Stamen Toner Lines"), options = layersControlOptions(collapsed = TRUE)) %>%
        hideGroup(c("temp", "precipitation", "snow", "wind"))
-
Code for the weather map: ↩